Project: InaSAFE
Version: 4.2.0
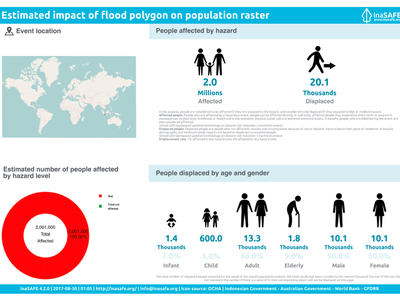
In InaSAFE 4.2 we have added infographic support again for analyses that use population exposure. Our revised implementation makes use of QGIS composer templates to provide pixel perfect layout positioning. The new implementation is generic for the demographic breakdowns, but Indonesia specific for the minimum needs portion of the infographic. By using the standard template overrides explained elsewhere in this changelog, you can customise the demographic reports for your own country or organisation's requirements.
The calculations for the demographic report are based on the ratio's assigned to your aggregation layer or counts assigned to your population layer, so be sure to run the keywords wizard on your aggregation or exposure layer if needed.
Note: The screenshot example provided here is based on contrived demographic ratios and is not intended to reflect a real-world scenario.