Project: InaSAFE
Version: 4.0.0
A major addition to InaSAFE 4.0 is the change in modality from providing reports as simple pre-rendered HTML pages to producing usable data for the analysis results. These data are in the form of GIS layers which are available for futher analysis, inspection and export to other platforms such as your favourite spreadsheet application. In the screenshot accompanying this changelog entry, you can see the result of an analysis. Unlike prior versions of InaSAFE, a number of analysis results are produced. These products include:
- The exposure summary layer: This layer will be familiar to users of previous versions of InaSAFE since it represents the hazard level assigned to each exposure feature in the analysis area. The records in the accompanying table will enumerate the exposure class, hazard class, aggregation name and details such as whether the feature is affected or not and its size.
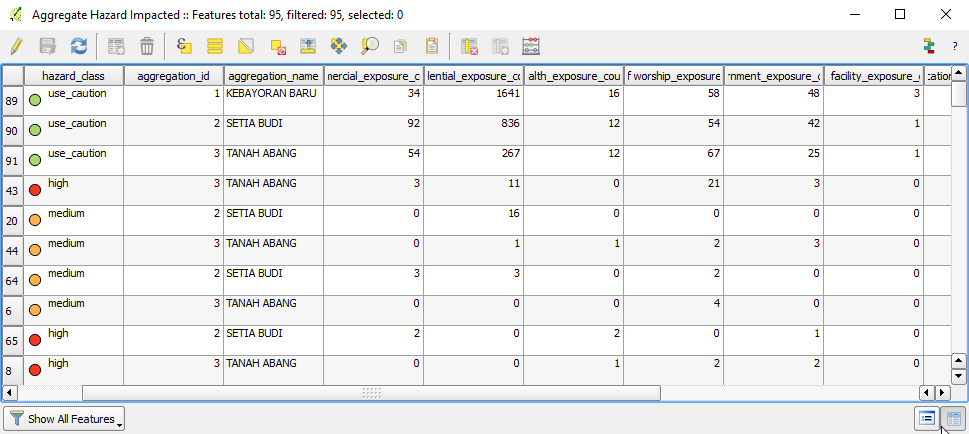
- The aggregate hazard impacted layer: This breaks down each aggregation area into sub-areas according to the hazard level in that area. The accompanying attribute table provides a detailed breakdown of the exposure features in each sub area, as shown in the screenshot below:
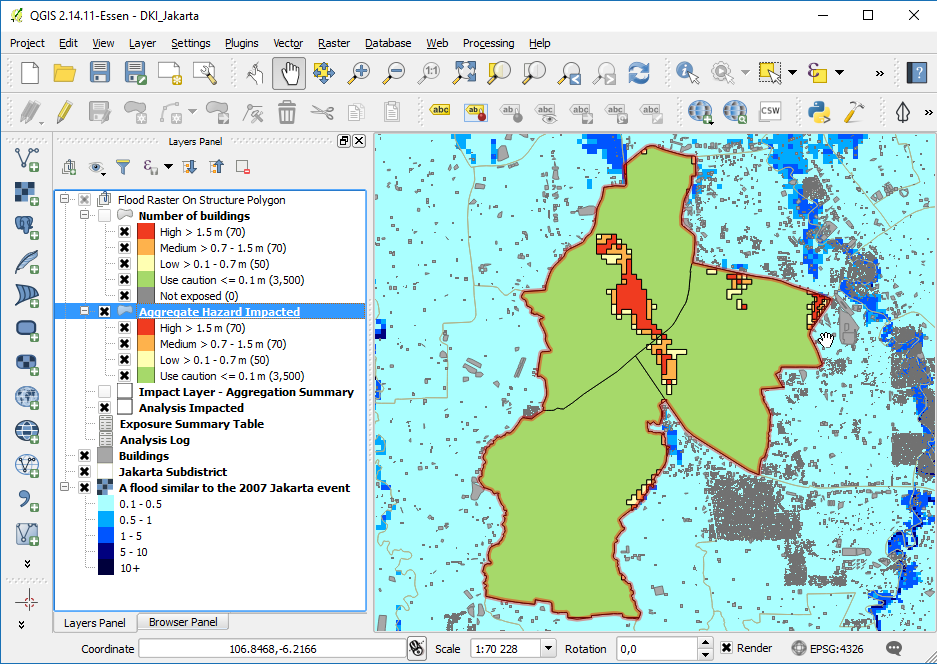
The same data represented as a map layer:
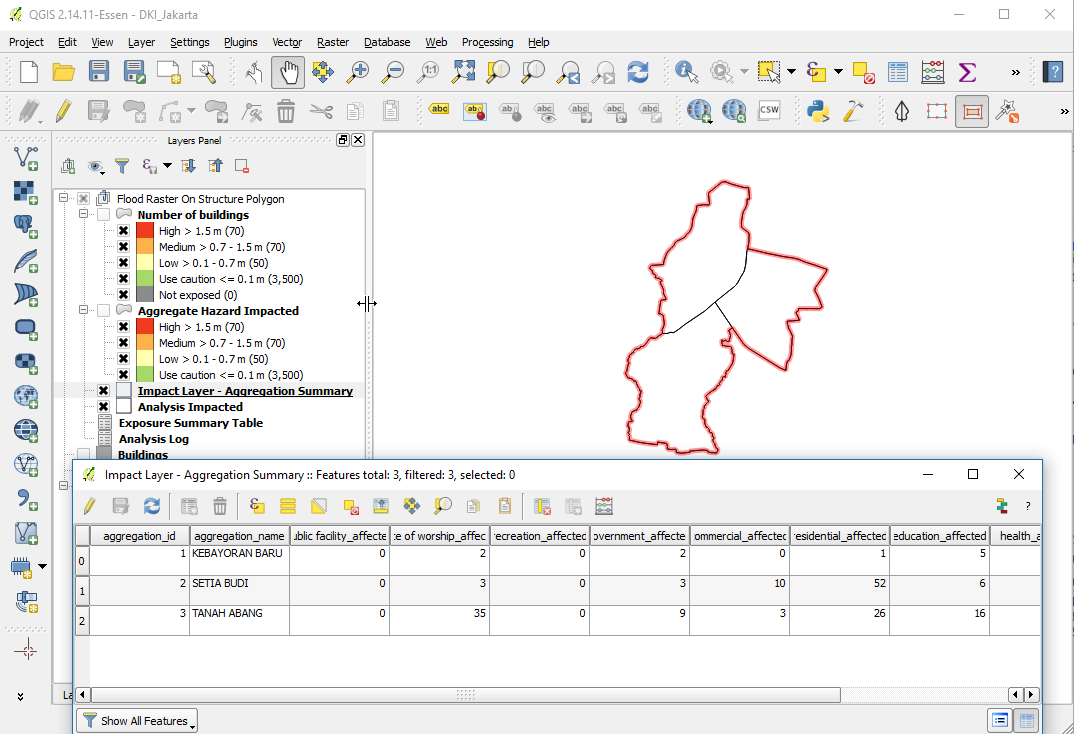
- Impact Layer - Aggregation summary: This layer provides a summary of exposed people or features within the analysis area. The summary is made per aggregation area, so for example, when carrying out an analysis aggregated by city district, the aggregation summary table will enumerate the districts with a break-down per exposure class provided for each district.
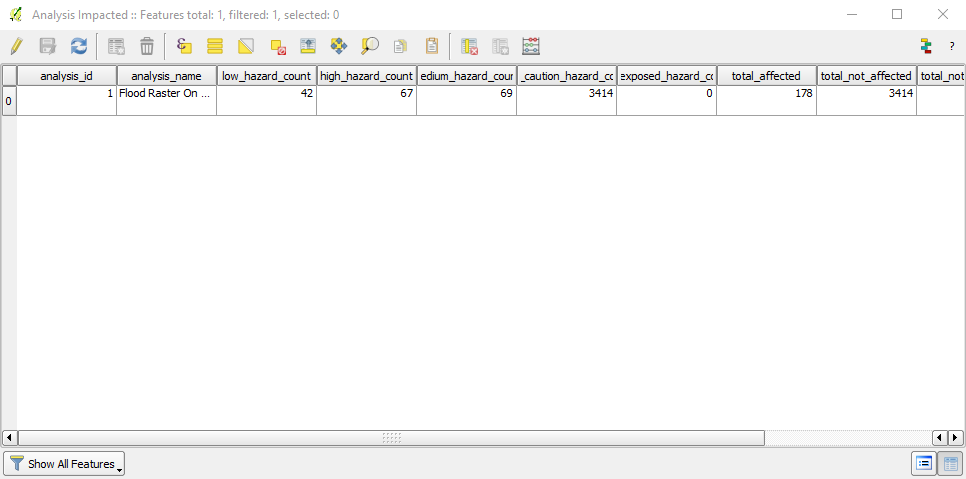
- Analysis Impacted: This layer represents the outline area of the analysis. The attribute table contains a single row with summary calculations for the entire analysis area.
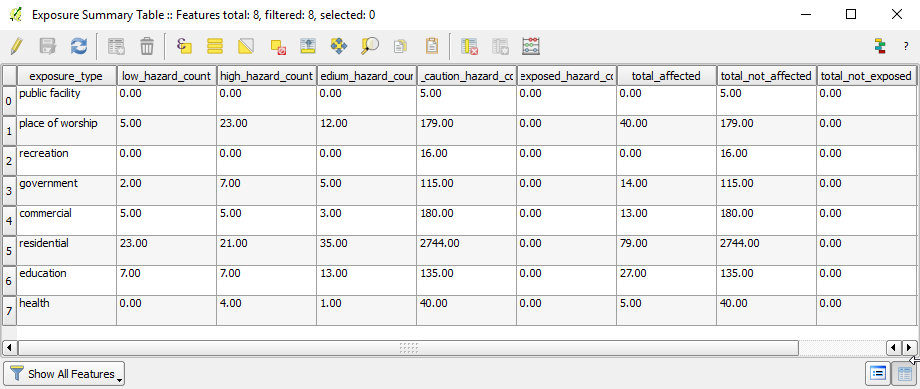
- Exposure Summary Table: This table (it does not contain spatial data) is a 'pivot' table - it provides a breakdown of impacted features by exposure type.
- Analysis Log: This table provides diagnostic information that can be provided to developers when trying to understand performance issues (should they arise) in an analysis.
This feature was funded by DFAT/WB-GFDRR