
Project: InaSAFE
Changelog for version: 4.0.0
Release date: 22 March, 2017
In the last few months we have been working really hard to get InaSAFE 4.0 ready. InaSAFE 4.0 represents a great shift in our approach whereby we will be able to drive a large part of the development of new hazards support and reporting by simply defining metadata. Some key aspects and goals of this work include:
- open up InaSAFE for 'casual' contributions of new functionality in a way which we were never able to offer before under the legacy architecture
- reduce a lot of the code that we maintain
- have a clear, well defined and replicable workflow for every analysis case
- pave the way for new potential use cases in response and post-disaster recovery
- provide the infrastructure for making beautiful rich reports and infographics
- deal with the many edge cases that we previously had no remedy for - like confusing outputs caused by interpolation which result in buildings that do not intersect the hazard being marked as affected (as one example)
Known Issues
- Infographics may in some cases exceed the space provided on a landscape A4 page. We recommend for now that you use the HTML infographic rather.
- Some standards are still being developed and applied, we will be continually improving on this in upcoming releases.
- Whilst we have made every effort to ensure that all reports produce accurate and reliable information, we encourage you to validate the results if at all possible.
- Some analysis results may differ from those of previous versions of InaSAFE since the underlying methodology has changed.
- Displacement rates are generalised estimates. Please help us to refine these rates if you have expert knowlege on the displacement rates that result when a particular hazard type occurs.
Special Note:
Please note that when migrating from InaSAFE 3.x to version 4, you need to update the metadata ‘keywords’ for any layer you have previously defined keywords for.
Tools
If you right click on a layer in QGIS, you will now find a convenient addition: An InaSAFE context menu that you can use to quickly launch the keywords wizard.
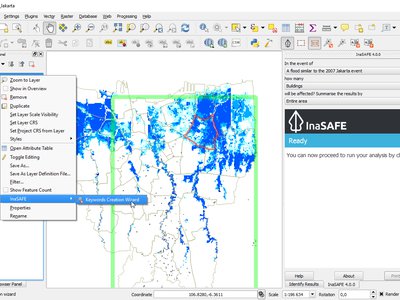
This feature was funded by DFAT/WB-GFDRR
This feature was developed by Kartoza
The batch runner is a tool that can run multiple scenarios consecutively. This can be useful both for testing and if you want to automate analysis and subsequent report production for an area. If you have a dataset that is being updated regularly (buildings for example), you can set up the batch runner to repeat the analysis easily. In InaSAFE 4.0 the batch runner now supports every data format that QGIS Supports.
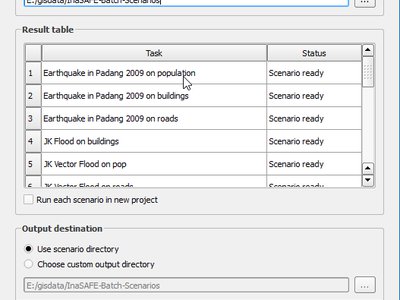
This feature was developed by DMI & Kartoza
In previous versions of InaSAFE, it was possible to use a point layer to represent hazards (specifically volcanos). InaSAFE 4.0 deprecates support for point based hazards and the internal point buffering we used to do internally when working with volcano points. Instead we provide a new tool that allows you to generate buffered concentric circles around each feature in a point layer, with a hazard level or class assigned to each ring. The output layer produced can then be used as an input for a volcano analysis. This tool is accessible in the menu at Plugins -> InaSAFE -> Mult Buffer.
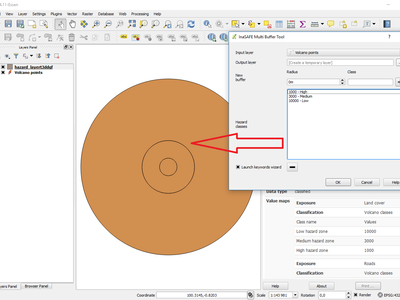
This feature was funded by Kartoza
This feature was developed by Kartoza
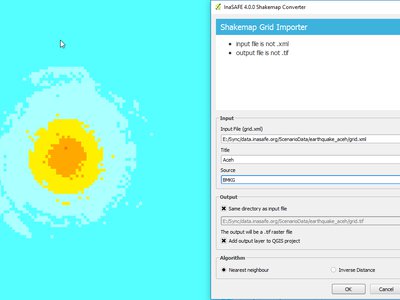
The shakemap converter tool is used to convert USGS format earthquake grid files to a GeoTIFF format file which is then suitable for use during InaSAFE analysis. In InaSAFE 4.0 the imported GeoTIFF will now automatically be classified so that each cell contains an integer value for MMI instead of a floating point value. We also write keywords for the produced layer, but these are population specific. If you wish to use the imported shakemap layer with other exposure types, be sure to run the keywords wizard first!
This feature was funded by DFAT
This feature was developed by Kartoza
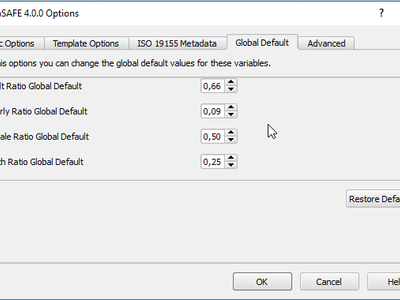
The age and gender defaults that used to be available in the dock have been moved to the options dialog. These are accessed from the QGIS Menu at Plugins -> InaSAFE -> Options -> Global Default. Global defaults are used when an aggregation layer does not have embedded gender and demographic ratios and the keywords for that layer specify that global defaults should be used.
This feature was funded by DFAT/WB-GFDRR
This feature was developed by Kartoza
Documentation
Our new InaSAFE help provides detailed technical documentation on all aspects of the software and provides many internal details so that advanced users can dig in and understand how InaSAFE operates. The help text is automatically generated from the detailed metadata that we have used to drive the behaviour of InaSAFE 4.0. Changing internal metadata such has thresholds and concept descriptions will change both the application behaviour, and the help reference text.
InaSAFE help can be access from the QGIS Menu at Plugins -> InaSAFE -> InaSAFE Help.
Note: You can open the help text in your web browser to by right clicking in the help window and choosing Open in web browser.
This feature was funded by The Australian Government and WorldBank/GFDRR
Reporting
The impact table from an impact layer has been styled so that it is easy to see what the hazard class for each row is. The colour of the symbol corresponds to the hazard class or threshold that each impacted feature is exposed to.
This feature was developed by Etienne Trimaille
The reporting system in InaSAFE had many limitations that made it difficult to produce reports according to our reporting standards. In InaSAFE 4.0 we have completely overhauled the reporting system to make it easy to extend the reports and deal with the many small nuances needed to produce rich, informative reports. We now use jinja2 to do report templating which provides a lot of flexibility in how we approach the generation of reports.
This feature was funded by DFAT/WB-GFDRR
This feature was developed by Kartoza
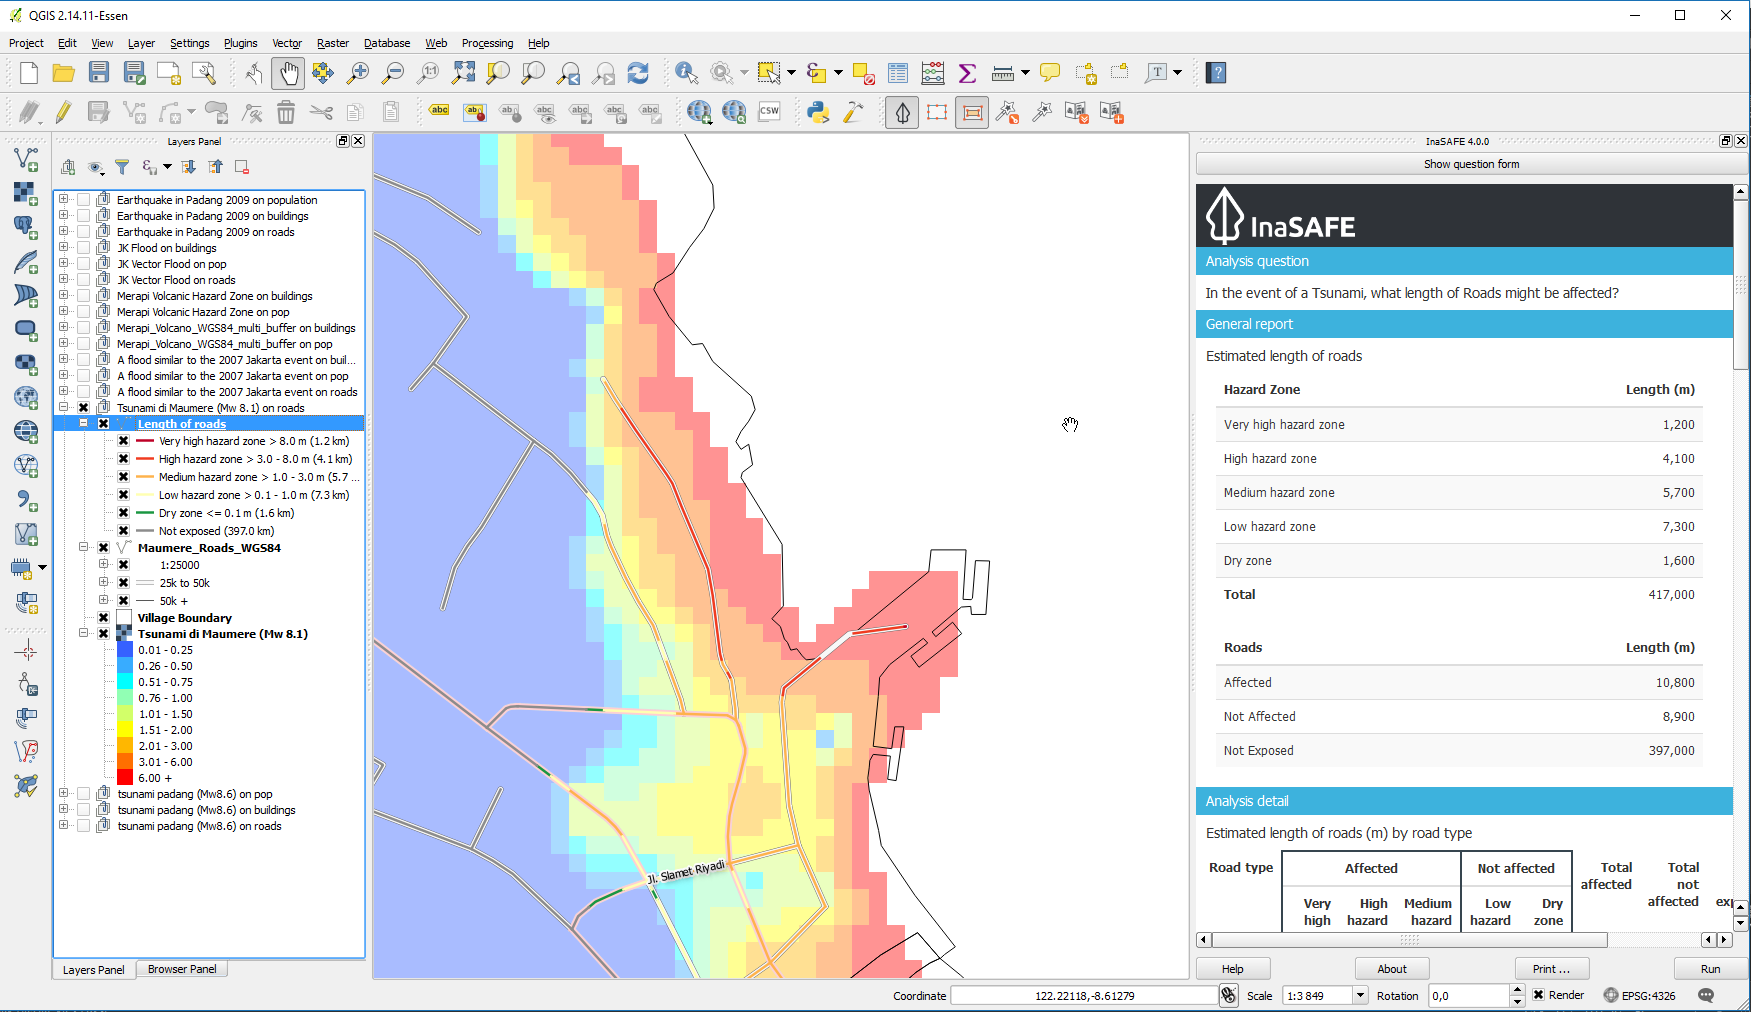
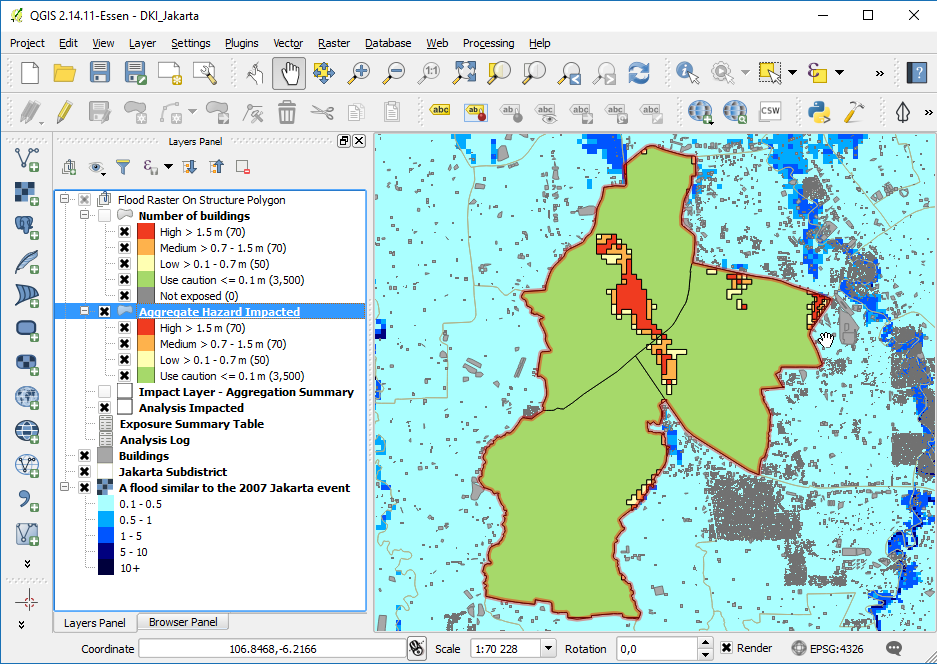
A major addition to InaSAFE 4.0 is the change in modality from providing reports as simple pre-rendered HTML pages to producing usable data for the analysis results. These data are in the form of GIS layers which are available for futher analysis, inspection and export to other platforms such as your favourite spreadsheet application. In the screenshot accompanying this changelog entry, you can see the result of an analysis. Unlike prior versions of InaSAFE, a number of analysis results are produced. These products include:
- The exposure summary layer: This layer will be familiar to users of previous versions of InaSAFE since it represents the hazard level assigned to each exposure feature in the analysis area. The records in the accompanying table will enumerate the exposure class, hazard class, aggregation name and details such as whether the feature is affected or not and its size.
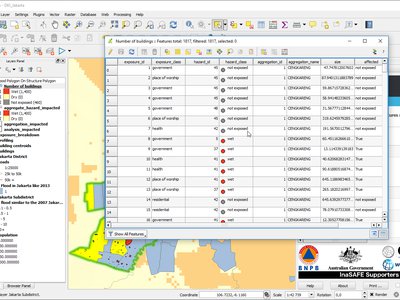
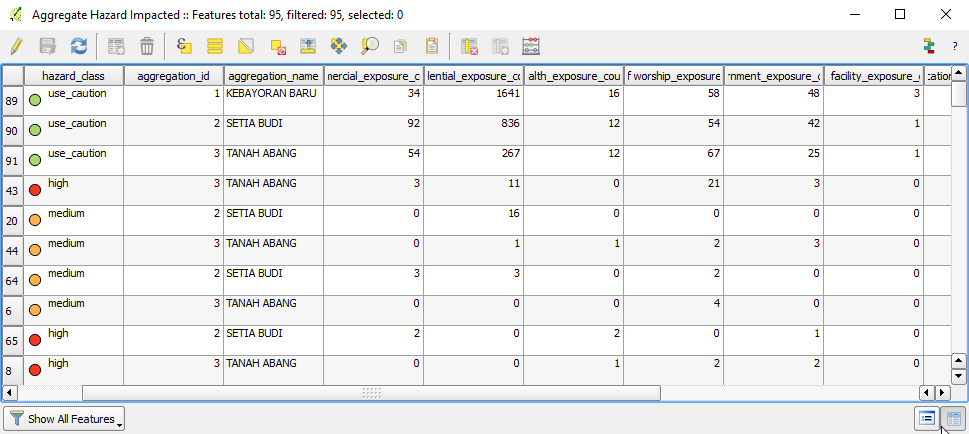
- The aggregate hazard impacted layer: This breaks down each aggregation area into sub-areas according to the hazard level in that area. The accompanying attribute table provides a detailed breakdown of the exposure features in each sub area, as shown in the screenshot below:
The same data represented as a map layer:
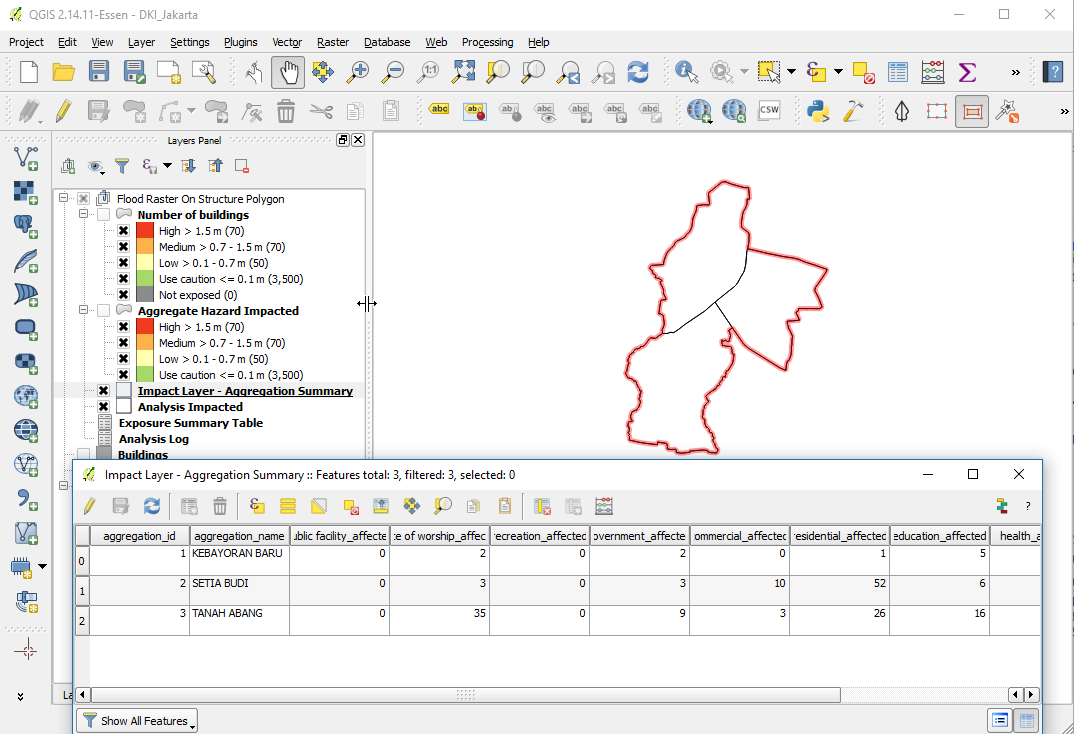
- Impact Layer - Aggregation summary: This layer provides a summary of exposed people or features within the analysis area. The summary is made per aggregation area, so for example, when carrying out an analysis aggregated by city district, the aggregation summary table will enumerate the districts with a break-down per exposure class provided for each district.
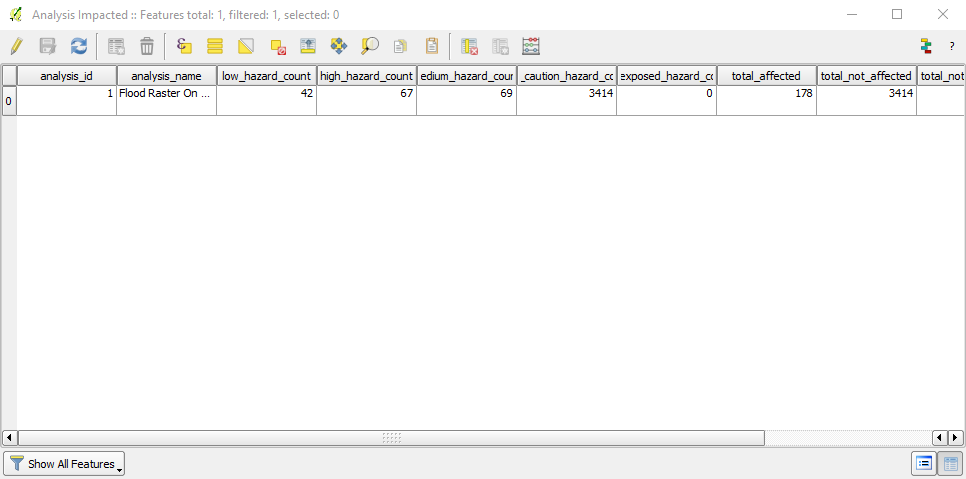
- Analysis Impacted: This layer represents the outline area of the analysis. The attribute table contains a single row with summary calculations for the entire analysis area.
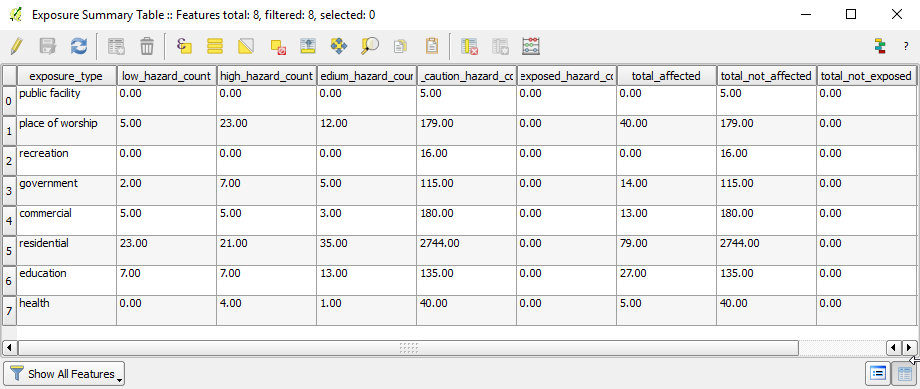
- Exposure Summary Table: This table (it does not contain spatial data) is a 'pivot' table - it provides a breakdown of impacted features by exposure type.
- Analysis Log: This table provides diagnostic information that can be provided to developers when trying to understand performance issues (should they arise) in an analysis.
This feature was funded by DFAT/WB-GFDRR
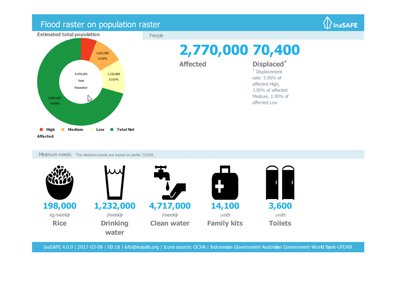
One of the improvements we have been working towards is the ability to produce non-tabular 'infographic' reports. Tabular data is information dense but often hard to communicate with, whilst infographics provide an opportunity to interpret an analysis outcome with a quick glance. Currently infographics are only produced for population exposure based reports, but we plan to add additional infographic reports in the future. One thing to note is that since we still occasionally experience layout issues with the infographic reports, we consider this feature experimental, but we are including the outputs in InaSAFE 4.0 so that we can get early feedback on the feature. For each population exposure analysis carried out, a PDF and an html (web page) document will be produced in the analysis working folder.
The population exposure infographic consists of a number of components:
- The estimated population donut chart: This provides an at-a-glance break down of how many people are thought to be affected in the hazard zone.
- The affected to displaced section: This contrasts how many people were thought to be affected by the event in total, with how many are thought to be displaced (having to leave their home and possessions and take up temporary residence in an Internally Displaced Persons camp).
- The minimum needs section: This enumerates what the key humanitarian requirements are estimated to be for those persons displaced. Note that minimum needs are configurable in InaSAFE from within the
Plugins -> InaSAFEmenu.
This feature was funded by DFAT/WB-GFDRR
Impact Functions
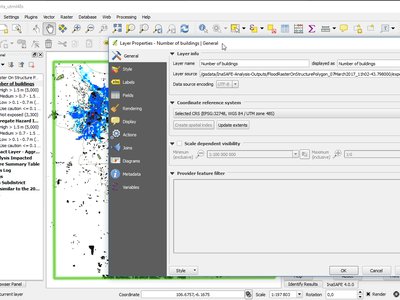
Since InaSAFE 4.0 now uses QGIS Layers for all the underlying analysis, we take advantage of this to provide the ability to use subsets (layer filters). This powerful capability means that you can now run the analysis with a specific subset of features. For example to do a flood on buildings analysis on schools only, we can filter a buildings layer to exclude all other building types and then run the analysis. This is demonstrated in the accompanying screencast, and the image below (which shows the report indicating only educational buildings). Note that the report numbers below are rounded to the nearest 10 units.
This feature was funded by DFAT/WB-GFDRR
In previous versions of InaSAFE, you generally needed to prepare and work with data in EPSG:4326 "Geographic" coordinate system. This was due to an underlying limitation of some of the analysis routines we used. In this release, you can now use data in any Coordinate Reference System - as aillustrated in the accompanying screenshot where we have carried out the analysis using UTM 48S data - and the resulting impact layer is also in this Coordinate Reference System.
This feature was funded by DFAT/WB-GFDRR
Tropical Cyclones (also known as hurricanes or typhoons) are an important hazard in the tropics. InaSAFE 4.0 introduces support for Tropical Cyclone based analysis. The following cyclone hazard classifications are supported:
- Australian Bureau of Meteorology
- Saffir-Simpson Hurricane Wind Scale
This feature was funded by WB-GFDRR
This feature was developed by Marco Bernasocchi
In the previous versions of InaSAFE, we spent a lot of effort building one impact function per hazard/exposure combination (and sometimes multiple impact functions per combination). In our new architecture, we try to deal with everything in the same way - by following a standardised process of converting the hazard dataset into a classified polygon layer and then calculating the impacted and affected areas using a standard worflow. A simplified version of this workflow is described here.
Because of this change, you will no longer see an impact function selector in the dock widget and there are no longer any 'impact function options' as we had in previous versions of InaSAFE. In the new system, almost all configuration is managed through metadata (created using the keywords wizard).
This feature was funded by DFAT & WB/GFDRR
This feature was developed by Kartoza
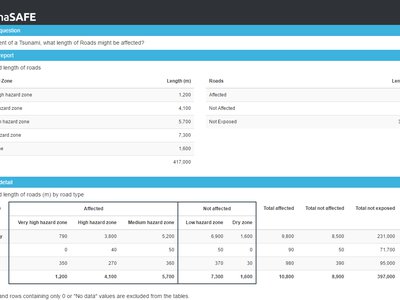
In prior versions of InaSAFE, there was not any convenient way to configure exposure specific thresholds for a hazard. A simple way to understand this is to consider a hazard like tsunami. A tsunami wave that is 50cm deep sweeping onto the shore might be extremely hazardous ('high hazard level') to any people occupying the affected areas, while it may constitute a 'medium hazard level' for buildings in the same area since most well built structures have the potential to endure such an inundation.
In InaSAFE 4.0 we have added support for per-exposure hazard thresholds definitions. These thresholds are configurable via a new step in the keywords wizard during the hazard keyword definition process. This is demonstrated in the screencapture attached to this changelog entry. During the analysis process, the thresholds specific to the exposure layer will be applied when determining if exposure features are affected or not.
Note: If you wish to run the same analysis with different hazard thresholds, you will need to run the keywords wizard for the hazard layer prior to each analysis, and then adjust the thresholds accordingly.
This feature was funded by DFAT/WB-GFDRR
In all versions prior to Version 4.0, we made heavy use of interpolation in order to determine whether buildings or other exposure layers are impacted. Whist this is a commonly used technique in GIS, it often leads to non-intuitive looking reports. Here is an example from the old version (see issue #1083:
Under our new architecture, we always use geometric overlay operations to make a determination whether an exposure feature is affected or not. The implication of this is that we produce intuitive and easily verifiable impact layers. You can see an example here:
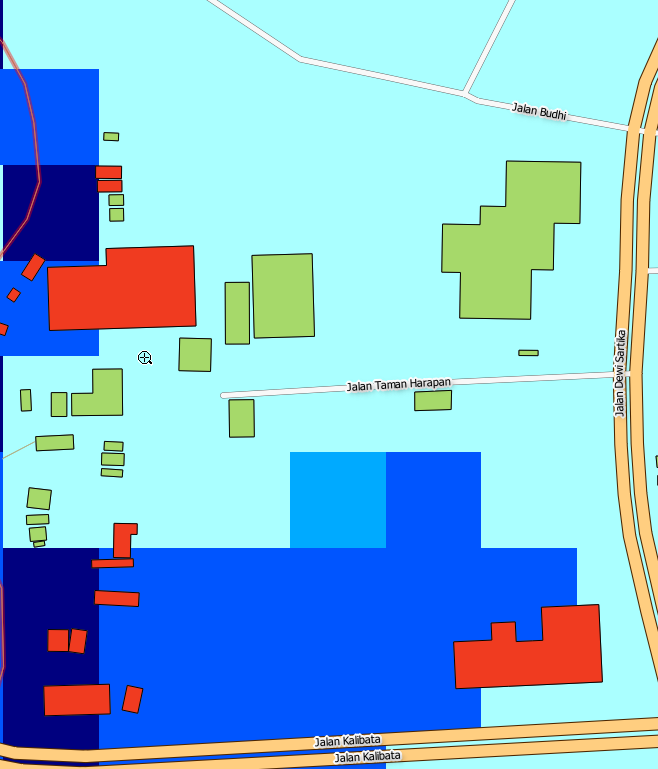
Another important improvement is the fact that the determination of what hazard level each exposure feature is assigned is based on the highest hazard that it touches. In older versions, it was indeterminate what the behaviour would be if, for example, a building touches two different zones of hazard level. Under InaSAFE 4.0 an exposure feature will always be assigned the highest hazard level that it touches. So if for example a building is partially flooded, it will always be considered to be flooded, even if another part touches a non-flooded area.
This feature was funded by DFAT & WB/GFDRR
Earthquake analysis has undergone an overhaul too. The spatial output of earthquake on population is now a raster symbolised to show whether each cell is thought to be a source of displaced people or not. This is illustrated in the accompanying screenshot. Also the choice of which algorithm to use for earthquake analysis has now been moved to the InaSAFE options dialog in Plugins -> InaSAFE -> Options -> Basic Options. The ITB Bayesian fatality rates algorithm is now used by default. Note that earthquake fatality estimates are now reported as ranges as shown in the second screenshot below. For example where we compute 57 fatalities, the report will show 0-100 fatalities. This is done to ensure that the report reader understands that the numbers are estimations and should not be construed as exact data.

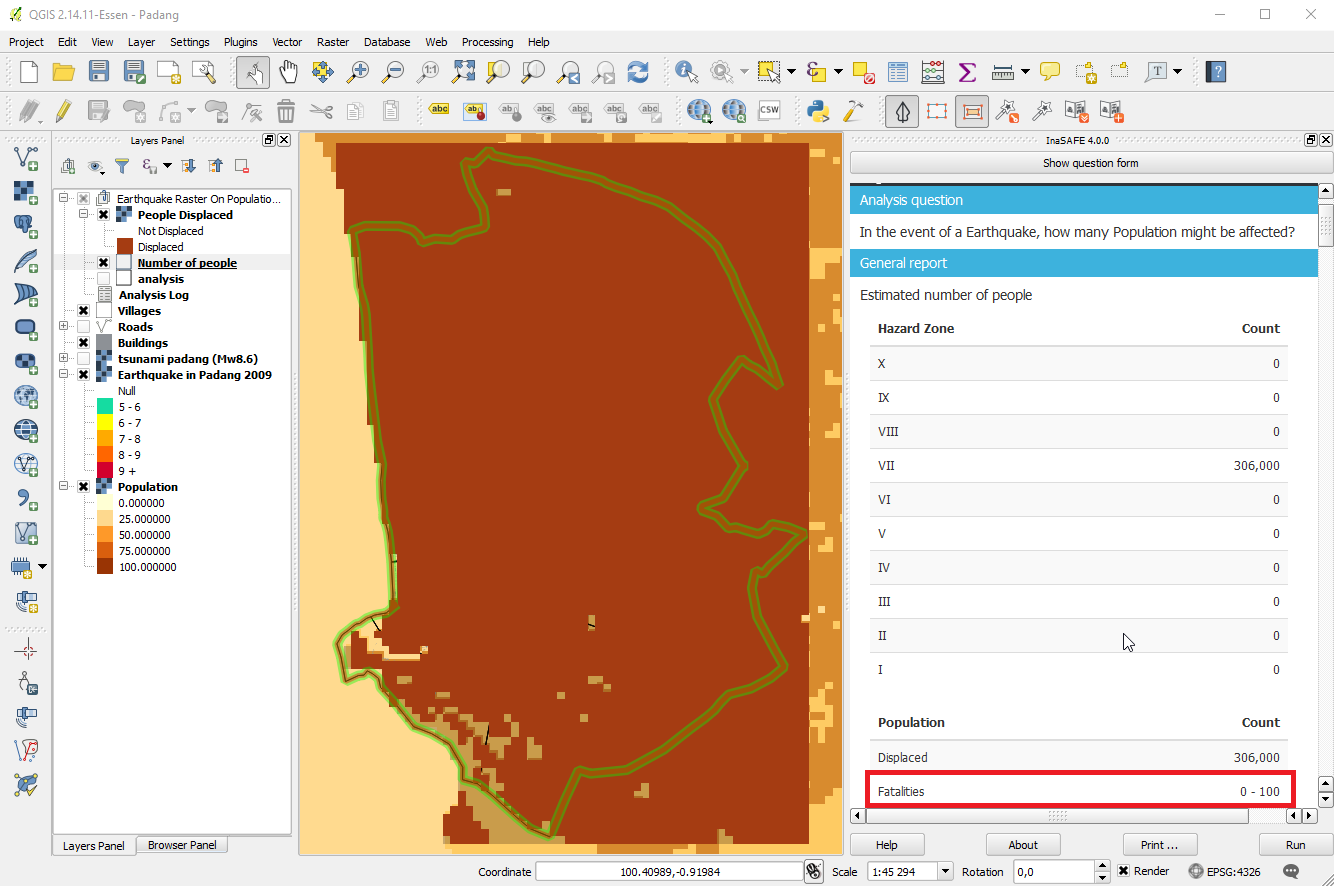
This feature was funded by DFAT/WB-GFDRR
This feature was developed by GA/Kartoza
In previous versions of InaSAFE, analysis was always carried out in rectangular areas. This has limitations - in particular that analysis results reported may not reflect the area of interest well. In InaSAFE 4.0, it is possible to use the polygonal outline of the aggregation area to constrain the analysis. This means that exposure features and population outside the aggregation areas will not be counted as part of the total counts, which makes the reporting more relevant for disaster managers trying to understand potential impacts.
Another key feature in irregular area support is that you can now select one or more districts using the QGIS selection tool - the analysis will only be run on the selected districts. Click play on the accompanying screencast to see how this feature works in action.
In InaSAFE 4.0 age and gender ratios are specified as part of the aggregation layer metadata. A simple precedence based system is used to determine where ratios should be derived from. This is controllable in part by the options in the keywords wizard according to this logic:
- If a layer attribute is selected from the layer's attribute table, this value is taken from the aggregation layer during analysis and is used exclusively (in other words global defaults and presets will be ignored). In the case that a feature has a null instead of a value for a given ratio, zero will be assumed.
- If 'no field' is selected for the ratio, and 'Do not use' is enabled, this ratio will not be calculated for final reports.
- If 'global' is used, the global ratio default will be used as default and any other potential sources will be ignored. The global default is taken from the InaSAFE options dialog.
- if 'custom' is used, you can enter a custom value into the input box provided and this value will be used in preference to any other potential source of ratio data.
InaSAFE will ensure that where ratios are interrelated (for example youth / adult / aged), their combined value will not be allowed to exceed 1.0.
We have also included detailed descriptions of each concept as shown in the accompanying screencast.
This feature was funded by DFAT/WB-GFDRR