

Layer styles and symbology
“GeoNode using GeoServer backend uses SLD layer symbologies”
When GeoNode is configured to use the GeoServer backend, it manages layers symbology through the SLD (Styled Layer Descriptor), which allows rich cartographic visualization. GeoNode also provides an interface for the customisation and modification of styles when using the SLD format. Users can upload and apply SLD styles created in desktop applications like QGIS Desktop and apply them to GeoNode layers.
The Mapstore online style editor for SLD only allows basic symbolization of layers and does not support all features available in SLD. SLD is an XML structured document that describes how spatial data should be symbolized. SLD styles can can be utilized for defining styles of both raster and vector data types.
GeoServer also supports styling layers as CSS. The CSS extension uses a CSS-derived language instead of SLD. These CSS styles are transposed into the SLD format by the server. A layer can have a single style or multiple styles applied, with each style representing a particular theme.
This module will outline the process of applying a layer style created in an external software application such as QGIS Desktop, and explore how to generate basic symbology using the MapStore GUI that comes with GeoNode instances configured to utilize Geoserver.
You try:
Goal: Learning how to manage layer styles in GeoNode
Exercise 01 - Using external SLD file
- Open QGIS and load the specified layer
- Symbolize the layer using the style tab in the layer properties
- Export the style from QGIS and save it on disk. Choose the option save as SLD layer style
Please note that the SLD file must be named exactly as the layer file it is to be applied to - If you are uploading a new layer to GeoNode, browse to select the layer from the disk and include the SLD style file with the upload
- If you are uploading a style for an existing layer on GeoNode, use the Styles Upload feature from the layers Edit Tools menu
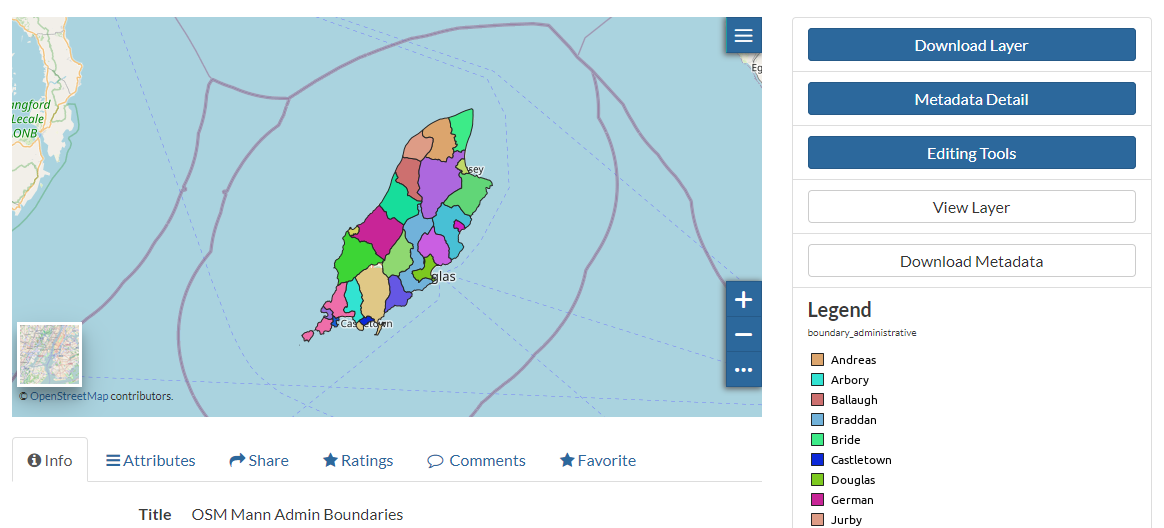
- Visualise the layer and the legend which is based on the style file
Exercise 02 - Using GeoNode GUI
- In the layers panel select Editing tools.
- Select Edit Style.
- Select the layer from the map viewer to make it active.
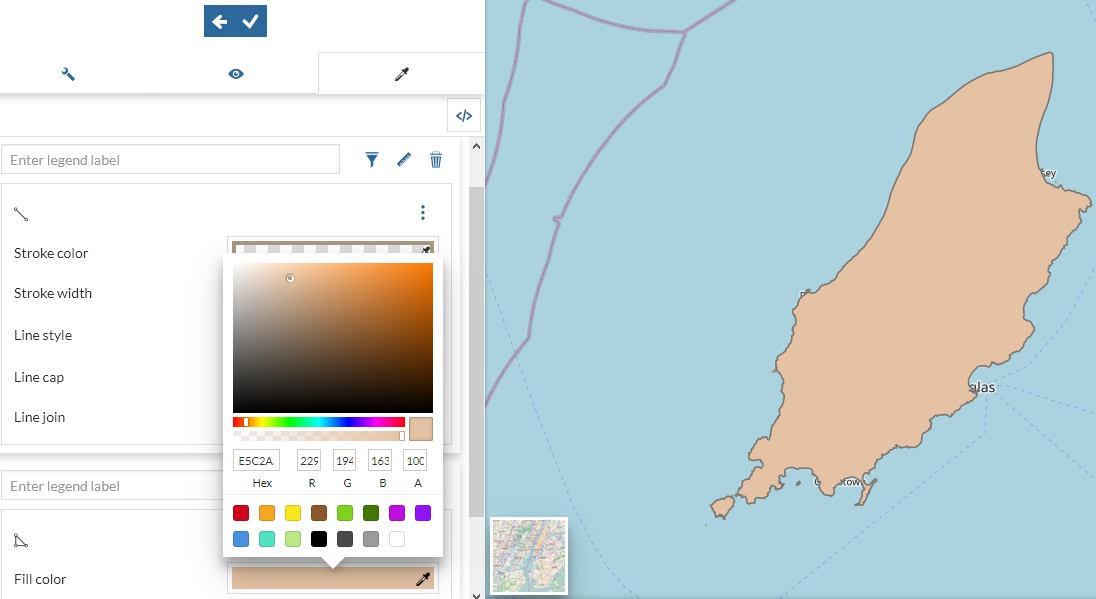
- Activate the selected layer settings and click on the style tab.
- Select create a new style.
- Choose a template that matches the data type you are trying to visualize.
- Choose the styling language from the two options given.
- Add the style and save it.
- Visualize the symbology
More about symbolising spatial data
If a layer is uploaded without a style file (.sld) GeoServer assigns random colors which becomes the default style of the symbology. If a user uploads a layer and includes a style file (.sld), the uploaded style becomes the default and users can upload a additional style files which will become alternate styles. When a layer has two or more styles the default style can easily be changed within the GeoNode interface.
Symbols allow you to illustrate unique differences between features, a difference in magnitude between related features, or various other data characteristics. Symbology can take on a range of functions in a map but should always endeavor to be clear, concise, and easily understood by the user.

Check your knowledge:
-
Can you also symbolize raster data using SLD:
- No, SLD is only used for vector data
- Yes, SLD can be used for multiple spatial data types
-
Is it possible to symbolize point layers with complex icons using SLD, such as Hospitals:
- No. SLD only supports basic symbology such as circles and squares
- Yes, you can generate quite complex symbology with SLD
-
Which of the following statements is false:
- You can have as many as 10 different SLD stylesheets for a single layer, with each representing a particular theme for a dataset
- If you do not add a style file (SLD) when uploading a layer, GeoNode automatically generates a random style for your data
- Raster data cannot be symbolized in the GeoNode GUI like vector layers
